iShares iBoxx $ High Yield Corporate Bond ETF
 iShares iBoxx $ Investment Grade Corporate Bond ETF
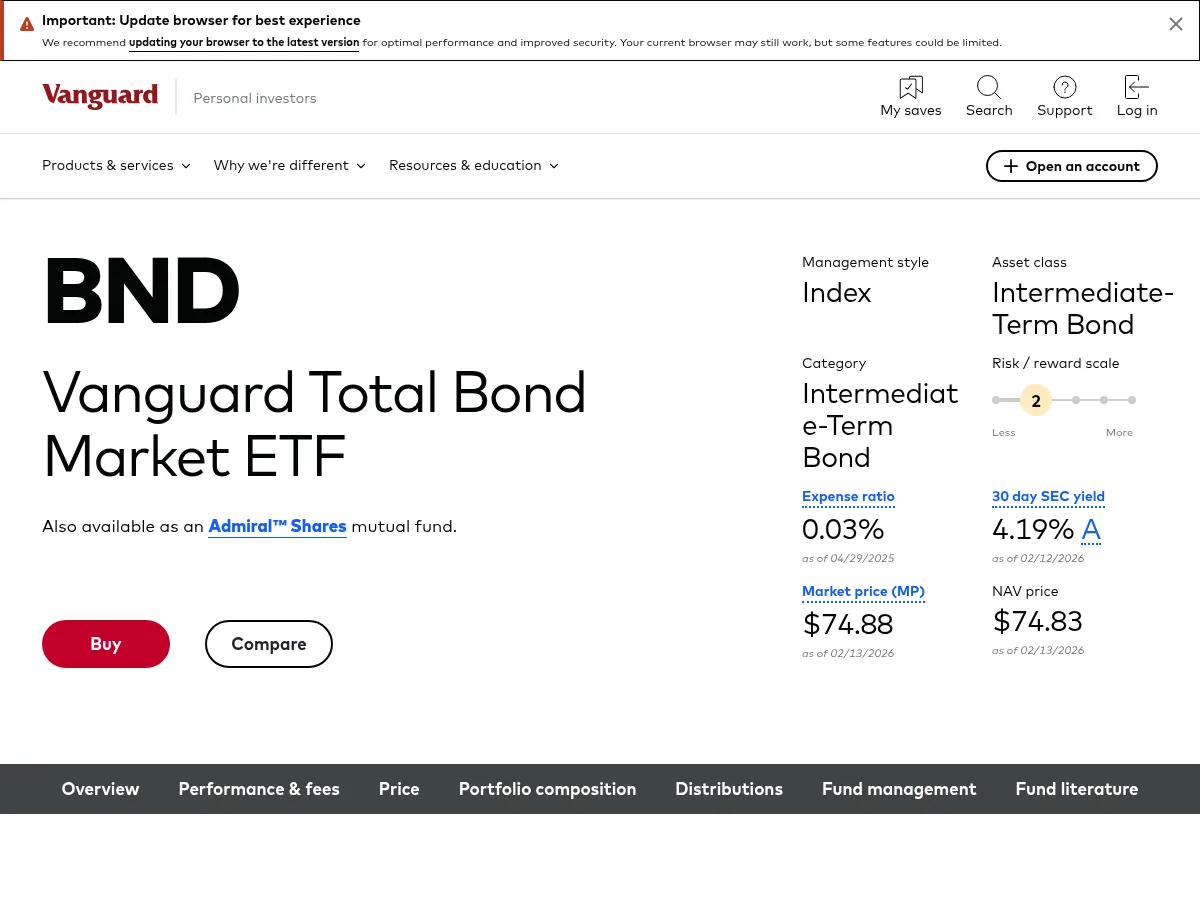
 Vanguard Total Bond Market ETF
 iShares Core U.S. Aggregate Bond ETF
 SPDR Bloomberg 1-3 Month T-Bill ETF
 iShares 20+ Year Treasury Bond ETF
How to Trade Stock Indices: S&P 500, Nasdaq, and Dow via ETFs, Futures, and CFDs
A stock index is a single number that summarizes the price action of a basket of companies. The S&P 500 tracks roughly 500 large US firms, the Nasdaq-100 tracks the 100 largest non-financial names on the Nasdaq exchange, and the Dow Jones Industrial Average follows 30 blue-chip stocks.